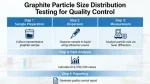
Quality control for graphite particle size requires representative sampling, proper dispersion to avoid agglomeration, and method matching to particle size range (sieving for >38 μm, laser diffraction for 0.1–1000 μm, dynamic imaging for shape+size, microscopy for <1 μm). Report D10/D50/D90, span, and distribution curves for actionable QC data.
1. Sampling: The Foundation of Reliable Results
Start with representative sampling to ensure results reflect the entire batch:
| Step | Action | Details |
|---|---|---|
| 1 | Collect primary sample | Follow GB/T 6679 or ISO guidelines; take 1 kg from multiple locations (top, middle, bottom of batch) |
| 2 | Reduce sample size | Use quartering method to shrink to 200 g while preserving particle size distribution |
| 3 | Homogenize | Mix thoroughly before analysis to eliminate segregation |
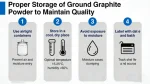
| 4 | Store properly | Keep in sealed containers to avoid moisture absorption or contamination |
2. Core Testing Methods (By Particle Size Range)
A. Sieving Analysis (Dry/Wet)
- Best for: Coarse graphite (>38 μm), graphite electrode granules
- Equipment: Stack of standard sieves (ISO 3310 or ASTM E11), sieve shaker, balance (0.01 g precision)
- Procedure:
- Stack sieves from largest to smallest mesh with a pan at the bottom
- Weigh 50–100 g sample, place on top sieve
- Shake for 10–15 minutes (follow GB/T 3520-2024)
- Weigh material retained on each sieve
- Calculate mass percentage retained/passed for each size fraction
- Advantages: Simple, low cost, easy to validate, good for production control
- Limitations: Poor for fine particles (<38 μm), cannot detect agglomeration, influenced by particle shape
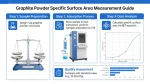
B. Laser Diffraction (Most Common for QC)
- Best for: Fine to medium graphite (0.1–1000 μm), battery-grade graphite
- Equipment: Laser diffraction analyzer (Bettersizer ST, Mastersizer 3000), ultrasonic disperser, dispersion unit (wet/dry)
- Critical Dispersion Steps:
- Wet method: Use water + surfactant (alkylbenzene sulfonate from dish detergent) to overcome graphite’s hydrophobicity
- Add 0.1–0.5% surfactant to water; sonicate for 30–60 seconds (avoid over-sonication which breaks particles)
- Dry method: Use RODOS dry dispersion system for water-sensitive samples (no dispersant needed)
- Procedure:
- Prepare dispersed sample (adjust concentration for 8–12% obscuration)
- Introduce to analyzer; instrument measures light scattering patterns
- Apply Mie theory (refractive index ~2.0 for graphite) to calculate size distribution
- Record D10, D50, D90 and distribution curve
- Advantages: Fast (30 sec), wide range, high precision, repeatable, minimal sample needed (<1 g)
- Standards: ISO 13320:2009, GB/T 19077-2016
C. Dynamic Image Analysis (DIA)
- Best for: Need size + shape data (e.g., flake graphite), battery materials
- Equipment: Dynamic imaging system (Malvern Morphologi G3, Sympatec QICPIC)
- Procedure:
- Disperse sample (wet/dry)
- Flow particles past camera; capture 10,000+ images for statistical validity
- Software analyzes particle dimensions (Feret diameter, aspect ratio, circularity)
- Advantages: Measures both size and shape, detects agglomerates, visual verification
- Applications: Battery anode materials (shape affects packing density and performance)
D. Sedimentation Methods
- Best for: Ultrafine graphite (<10 μm)
- Sub-methods:
- Gravity sedimentation: For 1–100 μm (ISO 13317-3)
- Disk centrifugation: Higher resolution for 0.01–10 μm; good for narrow distributions
- X-ray sedimentation: Enhanced sensitivity for nanoscale particles
- Procedure:
- Disperse sample in liquid medium
- Measure particle settling velocity (Stokes’ law)
- Calculate size distribution from sedimentation rate
- Advantages: Good for very fine particles, no shape assumptions, high resolution
E. Microscopy (Reference Method)
- Best for: Research, validation, or nanoscale graphite (<1 μm)
- Equipment: SEM/TEM (nanoparticles), optical microscope (micron-sized)
- Procedure:
- Prepare thin, well-dispersed sample on slide/grid
- Capture images (100× for optical, 10,000× for electron microscopy)
- Measure 200+ particles manually or via image analysis software
- Advantages: Direct visualization, shape information, gold standard for validation
- Limitations: Time-consuming, operator-dependent, small sample statistics
3. Critical Success Factors for QC
A. Dispersion: The Make-or-Break Step
Graphite’s high surface area causes agglomeration—invalid results without proper dispersion:
- Use surfactants (anionic: SDS, nonionic: Tween 80) to reduce surface tension
- Apply ultrasonication (30–60 sec at 20–40 W) to break soft agglomerates (avoid over-treatment)
- For wet methods, use alcohol (ethanol/isopropanol) if water causes floating issues
- Verify dispersion with:
- Laser diffraction: Check consistency before/after sonication
- Dynamic imaging: Visual confirmation of individual particles
B. Method Selection Guide (QC Perspective)
| Application | Particle Size | Recommended Method | Key QC Metrics |
|---|---|---|---|
| Graphite electrodes | 100 μm–5 mm | Sieving analysis | D50, % >1 mm, % <100 μm |
| Battery anodes | 5–50 μm | Laser diffraction + DIA | D10, D50, D90, span, aspect ratio |
| Lubricants | 1–20 μm | Laser diffraction | D90 <20 μm, narrow distribution |
| Conductive additives | <5 μm | Laser diffraction + disk centrifugation | D50, % <1 μm |
| Nanographite | <1 μm | TEM + dynamic light scattering | D50, particle size distribution width |
C. Standards Compliance
Follow these standards for consistent QC results:
- GB/T 3520-2024: Graphite fineness test method (China)
- ISO 13320:2009: Particle size analysis—Laser diffraction methods
- ISO 3310: Test sieves—Technical requirements and testing
- ASTM B822: Standard test method for particle size distribution of metal powders
- ISO 9276-2: Representation of results of particle size analysisISO
4. QC Implementation Workflow
- Establish specifications: Define acceptable D10/D50/D90 ranges, span (D90-D10/D50), and distribution shape for your application
- Select method: Match to particle size range and production needs
- Calibrate equipment: Use certified reference materials (e.g., NIST SRM 1960)
- Sample preparation: Follow standardized protocols (sampling → dispersion)
- Measure: Run 3 replicate tests for statistical confidence (RSD <5% for reliable results)
- Data analysis:
- Calculate percentiles (D10, D50, D90)
- Compute span to assess distribution width
- Plot cumulative distribution curves and frequency histogramsISO
- Interpret results: Compare to specifications; flag out-of-spec batches
- Documentation: Record all parameters (method, dispersion, equipment settings, results) for traceability
5. Troubleshooting Common Issues
| Problem | Cause | Solution |
|---|---|---|
| Inconsistent results | Poor dispersion, sampling errors | Improve dispersion protocol; re-sample; check equipment calibration |
| Unexpected large particles | Agglomeration, contamination | Increase sonication time; filter samples; inspect raw materials |
| Floating particles (wet method) | Hydrophobicity | Use surfactant or switch to alcohol-based dispersion |
| Narrower distribution than expected | Over-grinding | Reduce milling time; check process parameters |
6. Best Practices for Production QC
- Automate: Use online laser diffraction for real-time process control
- Frequency: Test every batch; increase frequency during process changes
- Correlate: Link particle size data to product performance (e.g., battery capacity, electrode conductivity)
- Train operators: Ensure consistent sample preparation and method execution
- Maintain equipment: Regularly clean sieves, dispersion units, and optical components
Final Recommendation: For most industrial graphite QC applications, use laser diffraction as the primary method (0.1–1000 μm range) with dynamic image analysis for shape verification. Pair with sieving for coarse fractions (>38 μm) and microscopy for method validation. Always prioritize proper dispersion and representative sampling to ensure data integrity.